Catalina Island Bison GPS Collars & Location Data
In 2014 we fitted five Catalina Island bison with global positioning system (GPS) collars to locate the herds systematically and track their movements on the landscape. This article includes information on the GPS collar specifications and a preliminary assessment of the location data we collected.
This post complements an earlier article titled Thiafentanil and Medetomidine Used to Sedate 5 Catalina Island Bison and has been pulled directly from Appendix C. of my graduate thesis. It is intended to support others attempting similar research efforts but also provides some interesting information about the suitable bison range on Catalina Island, the carrying capacity of bison on the island, and where they roam.
Selecting the Right GPS Collar for Catalina Island Bison
To improve my ability to locate bison cows systematically for behavior monitoring and fecal sample collection, I employed the use of satellite-linked GPS collars. At the initiation of my study, I anticipated using Globalstar Track M GPS collars manufactured from Lotek Wireless, Inc. based on their deployment on more than 40 free-ranging bison in Utah’s Henry Mountains.
After speaking with one of the Utah study organizers, however, I was alerted to several significant failures that they had experienced with these collars. Specific issues involved the damage or complete shearing off of the satellite antenna, which was housed in a box on the apex of the collar.
In my communications with Lotek about this issue, they offered to reinforce the antenna box, an option that was also attempted and had failed in the Henry Mountains bison project, but they were not willing or able to adjust the profile of the satellite box.
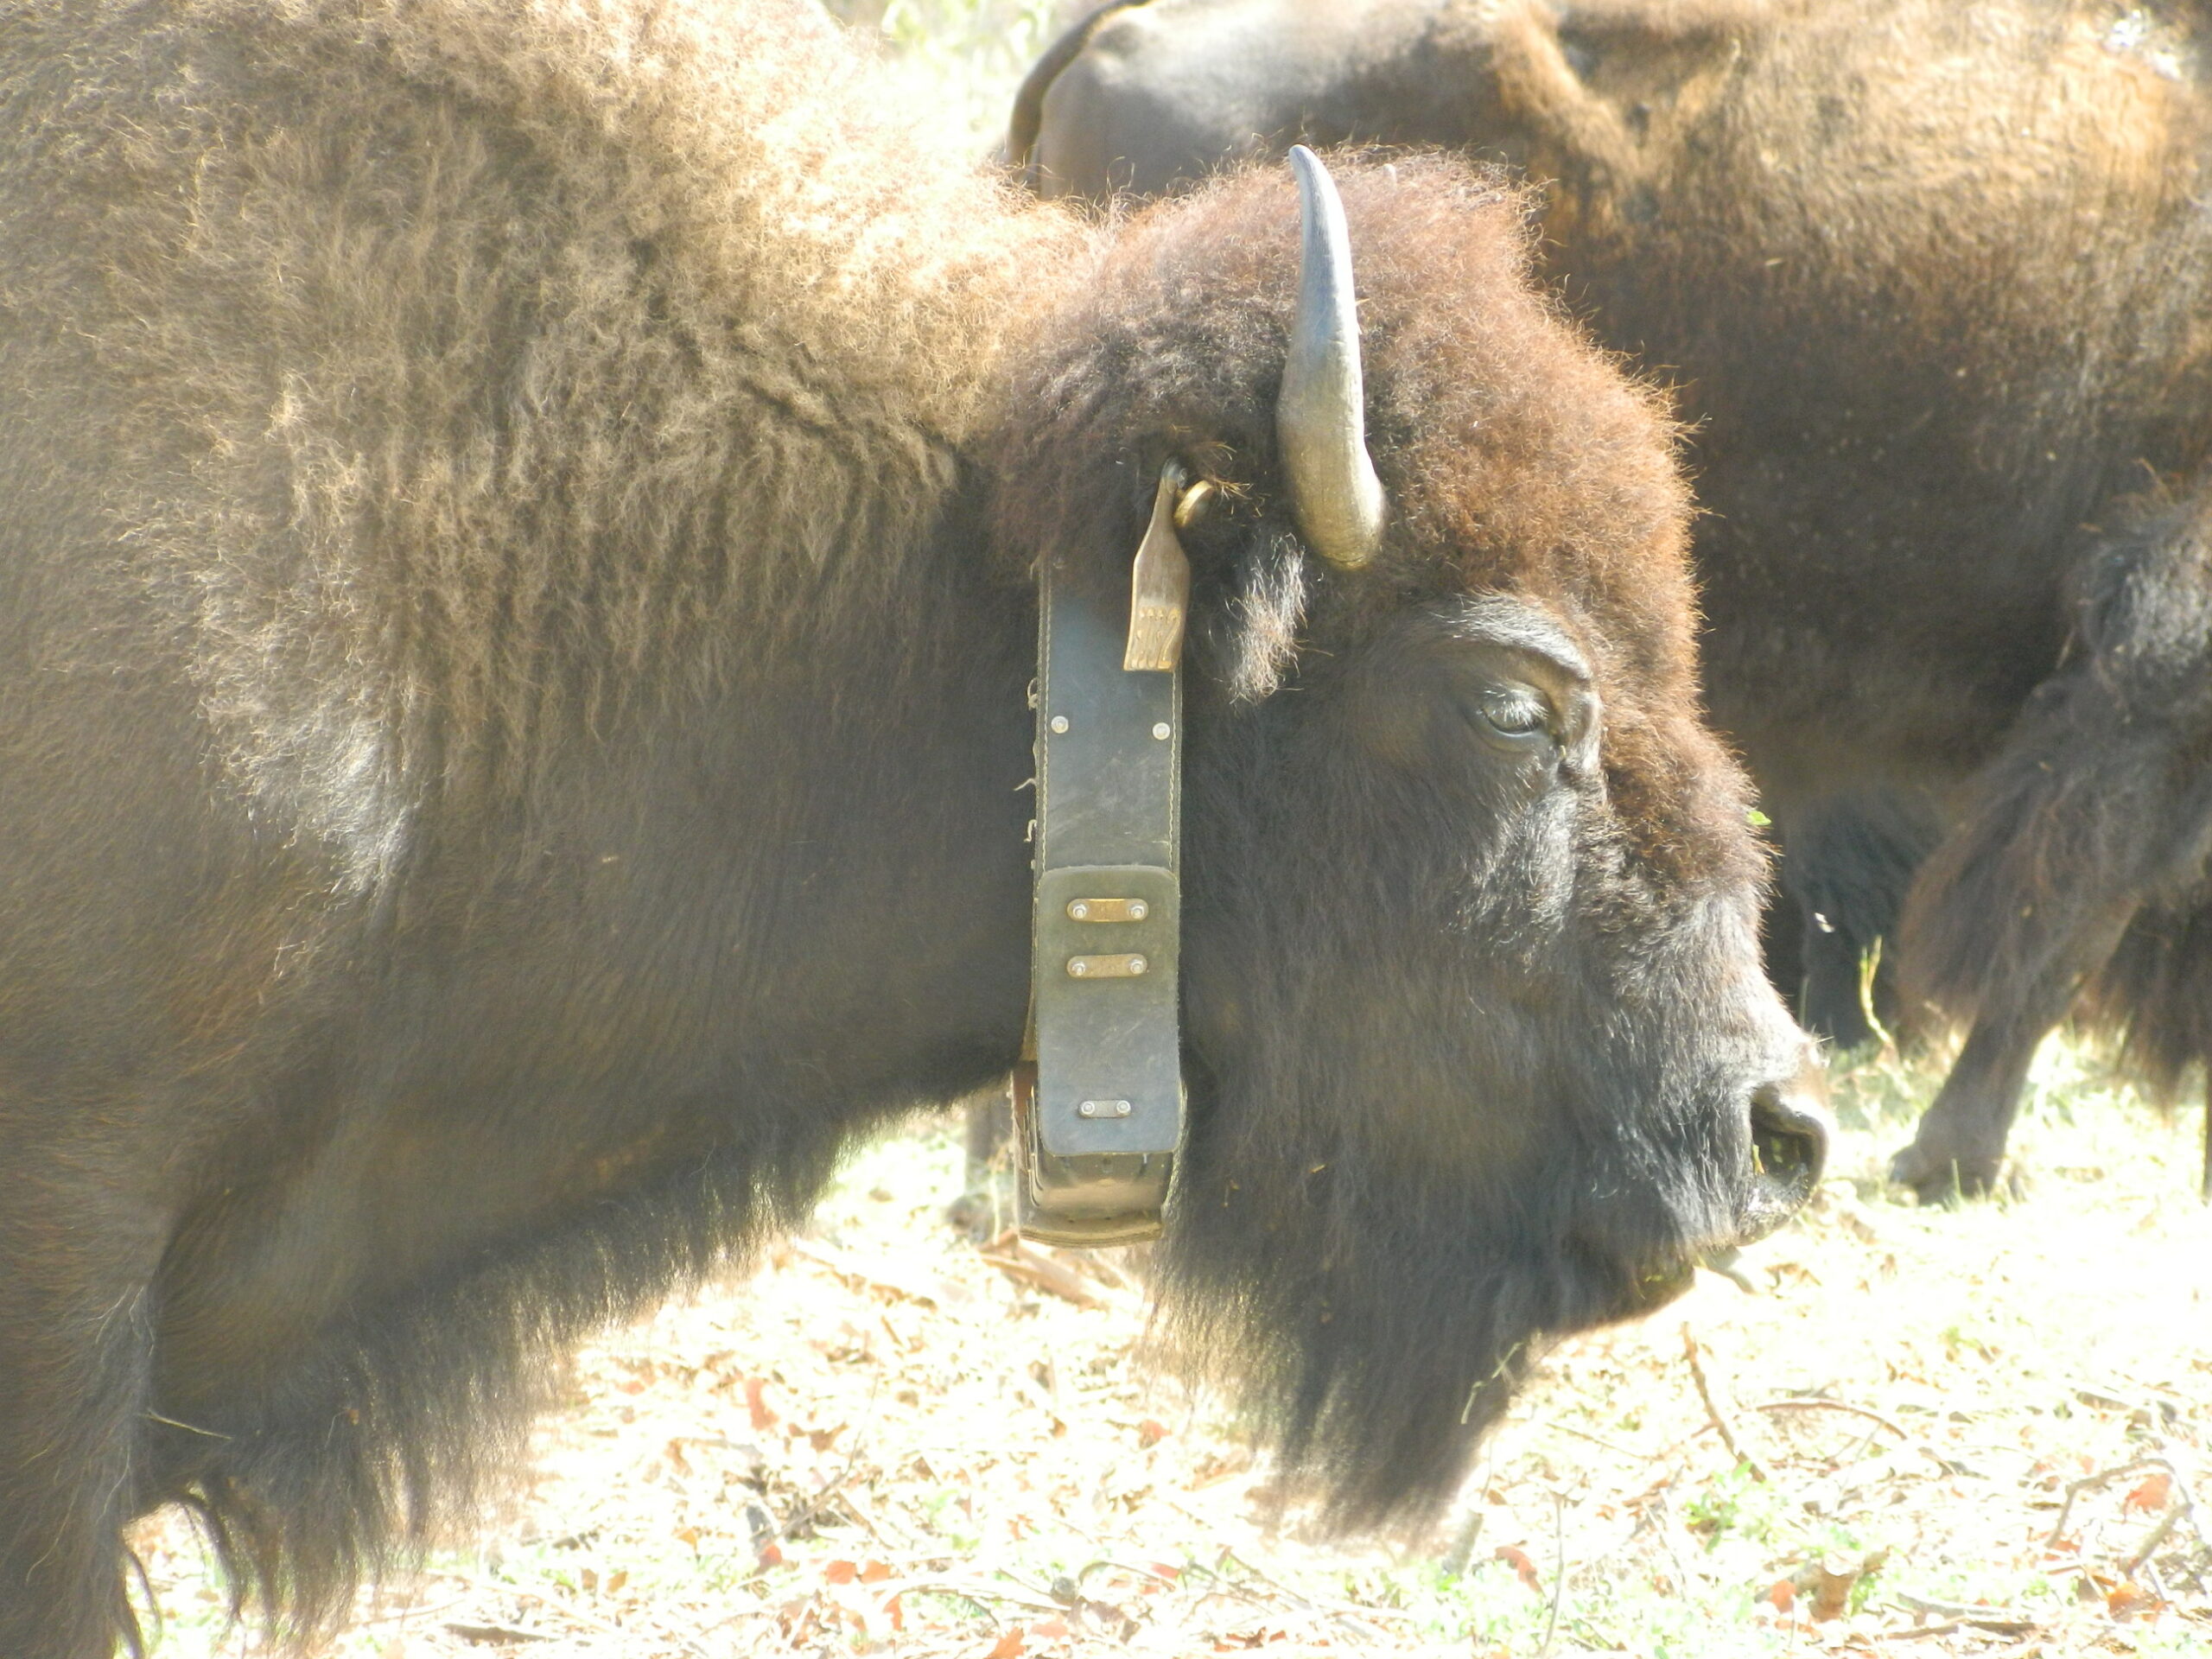
With these concerns in mind, I began investigating the G2110E Iridium GPS collar from Advanced Telemetry Systems (ATS). Based on my concerns, ATS offered to streamline their satellite antenna, reinforce it, and enclose it within the belting of the collar in order to protect it from impacts incurred during wallowing or rubbing.
Due to lingering concerns about the potential failure of one or more collars, I increased my fundraising efforts and chose to deploy five G2110E Iridium GPS collars at approximately $3,500 each (approximately $1,500 less than the Loteck collars) plus service fees ($30 per collar) and location fix fees ($0.04 per location), with the intentions that as least three would operate sufficiently throughout the duration of my study.
Each collar weighed 825 g, and the collar circumference range was approximately 71-117 cm. This circumference range proved to be much larger than needed for Catalina Island bison, which are considerably smaller than their mainland counterparts.
Selecting the Right Bison to Wear the Collars
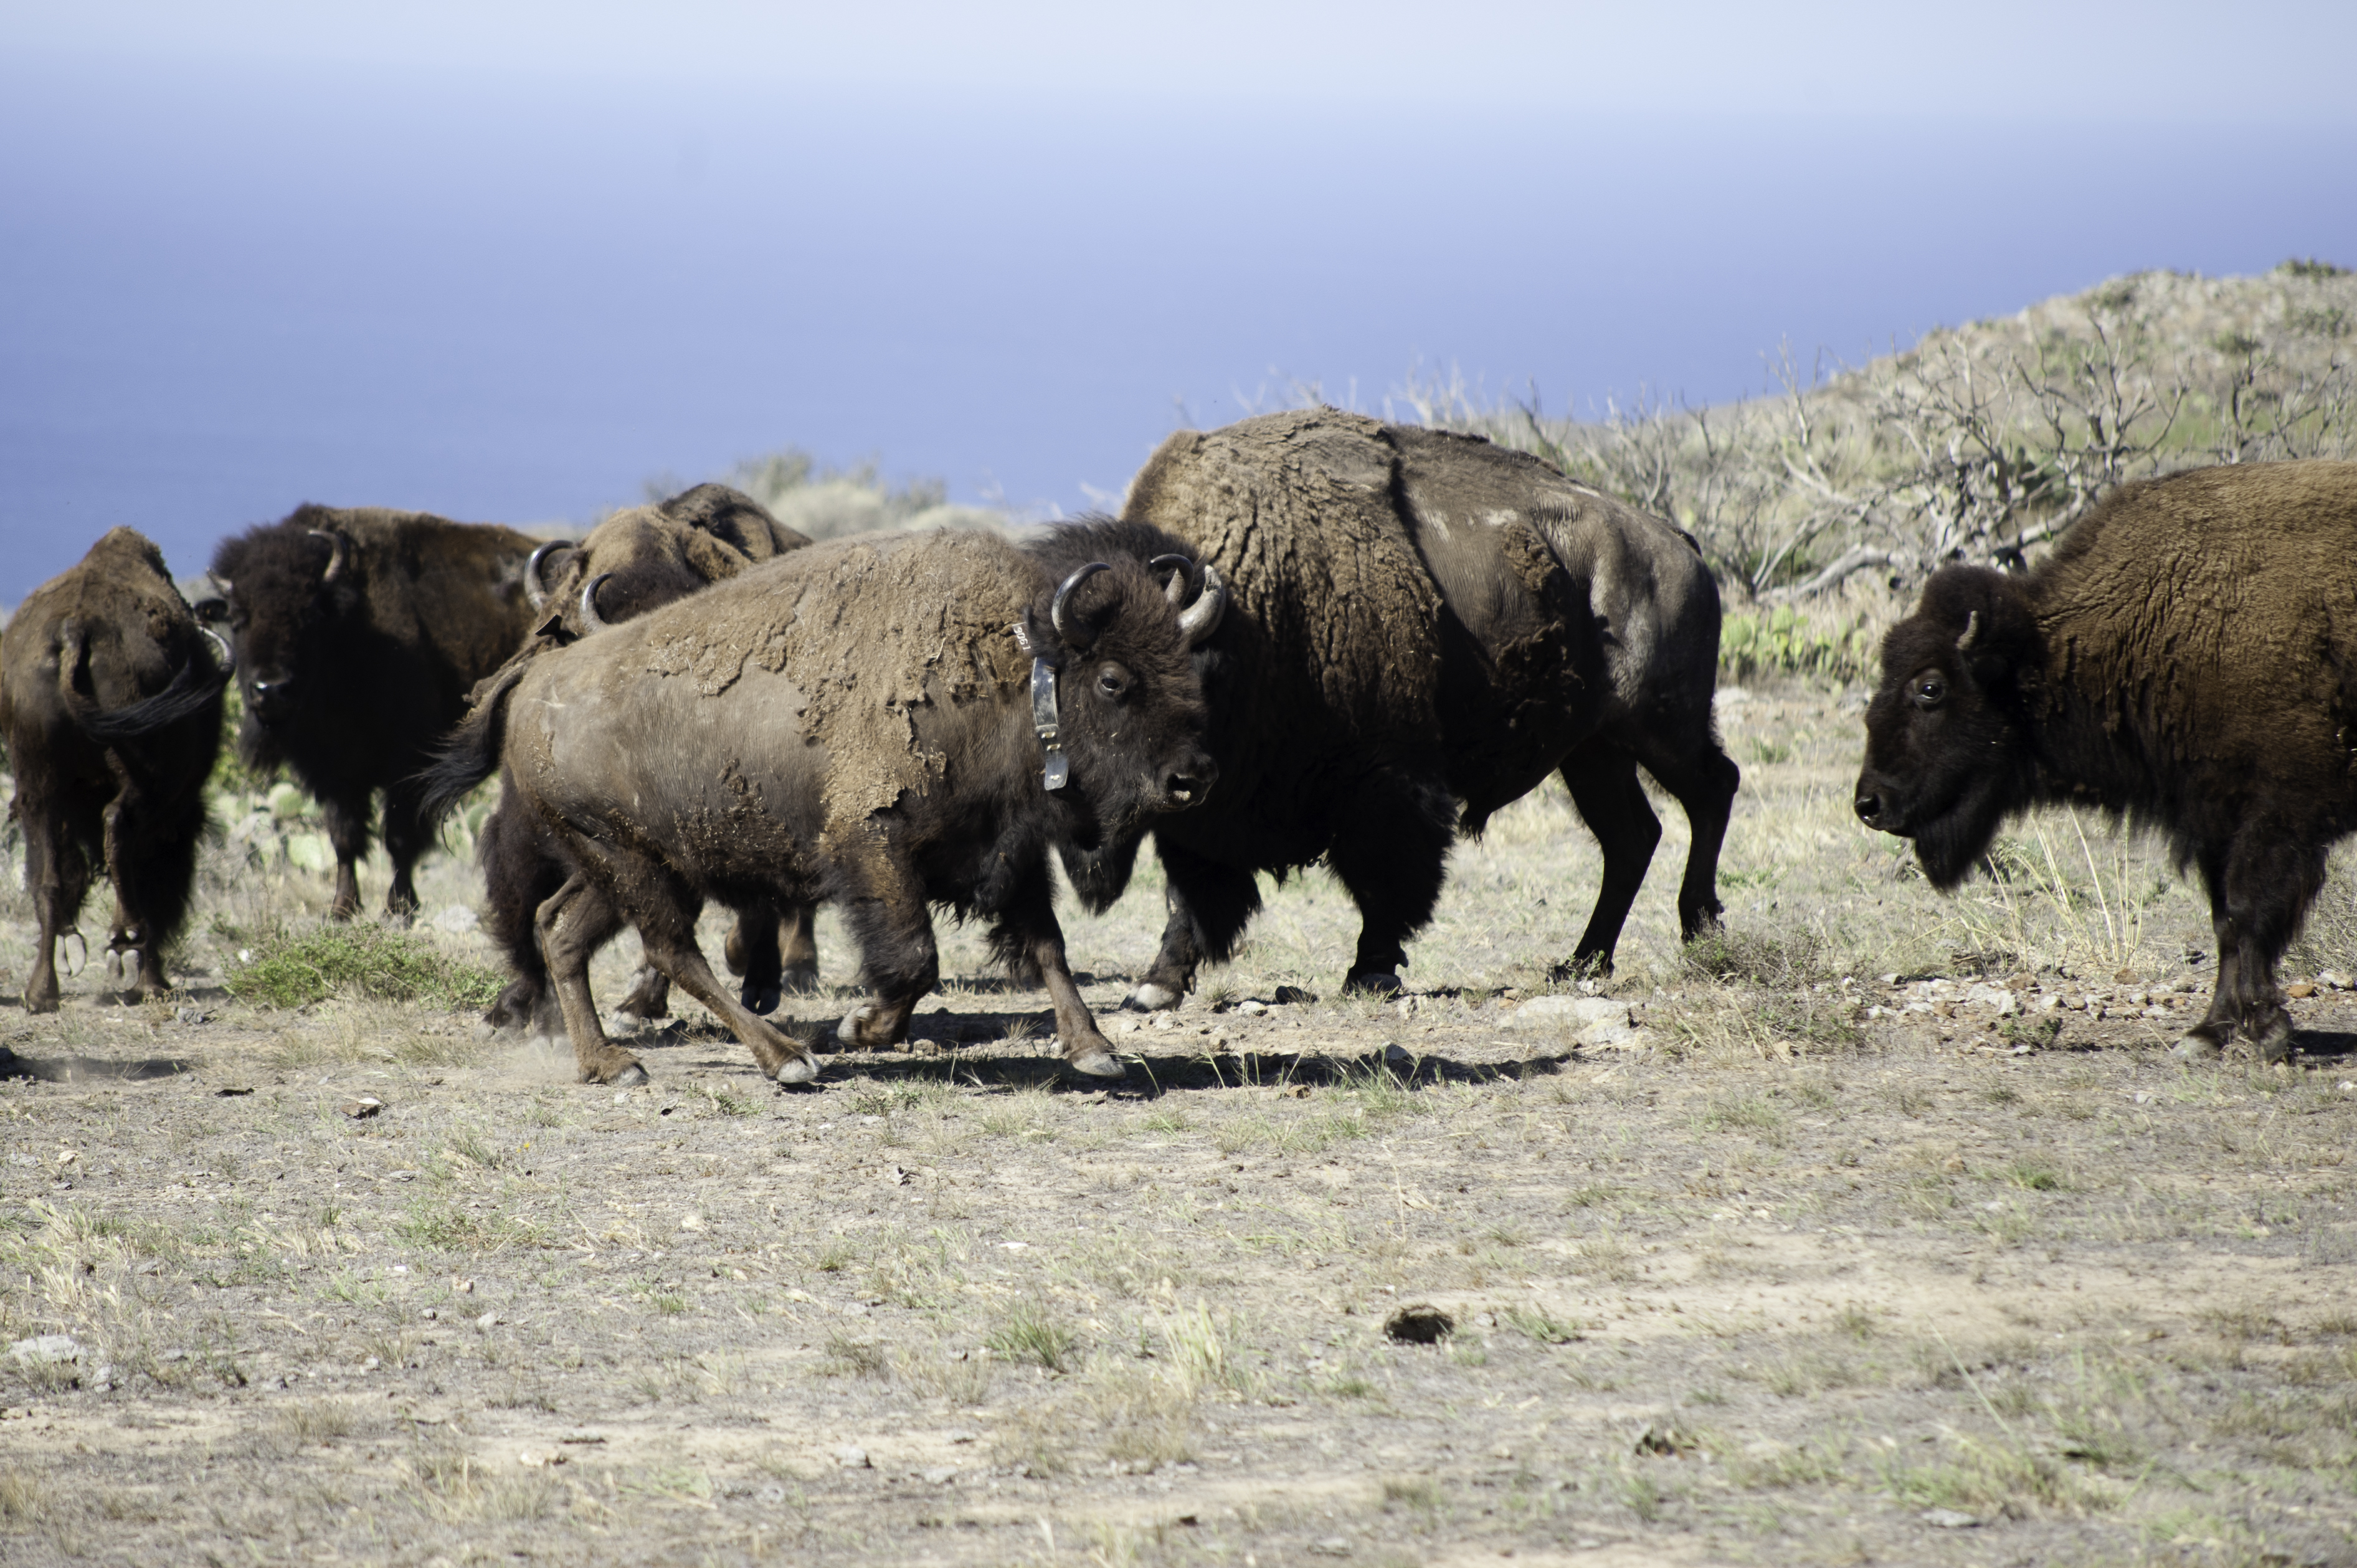
Five bison cows (#s 9032, 9056, 9059, 9060, and 9061) were selected to wear the collars based on prior monitoring data that suggested that these individuals were not commonly found together in the same family groups, and would therefore allow us to locate most if not all of the cows at any given time.
These individuals were also chosen because they had not been previously captured during round-up efforts so had not been marked with ear tags or had biological samples such as blood or hair collected for cattle gene introgression analysis.
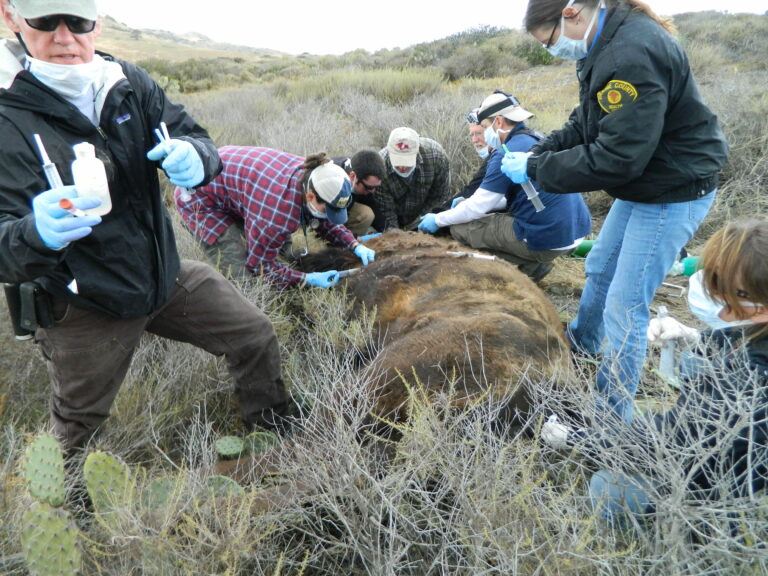
The GPS collars were deployed on three bison cows on May 10, 2014, and two additional cows on May 11, 2014.
The collars were initially programmed to attempt location fixes every three hours and transfer the data to the satellite every 12 hours. However, due to the ability of bison to move great distances over short periods of time, and periodic failed attempts to find them using this setup, the fix rate was increased to every 30 minutes, with data transfers to the satellite every four hours throughout the sampling and contraception application portions of the study (13 months; June 1, 2014, to June 30, 2015).
After the primary study period, the location fix and transfer rates were reduced again in order to extend battery life.
Three weeks after deployment, one of the collars malfunctioned (bison cow #9056) and quit storing location data. Representatives from ATS suggested that antenna damage was likely the issue, but coincidently the malfunction occurred at the same instant that data had been downloaded from the collar.
After several attempts to resolve the issue remotely, the drop-off mechanism was eventually triggered; the collar was recovered and sent back to ATS for replacement. Due to several delays associated with each phase, a replacement was unavailable until April 2015 and was, therefore, not redeployed until May 8, 2015.

My ability to download location data in nearly real-time greatly improved my ability to locate all of the bison cows within my study consistently; however, there were still limitations due to topography, inclement weather, road access, safety concerns, and cooperation of the bison, in my ability to collect behavior data and fecal samples as systematically as I had anticipated.
Where the Bison Roam on Catalina Island
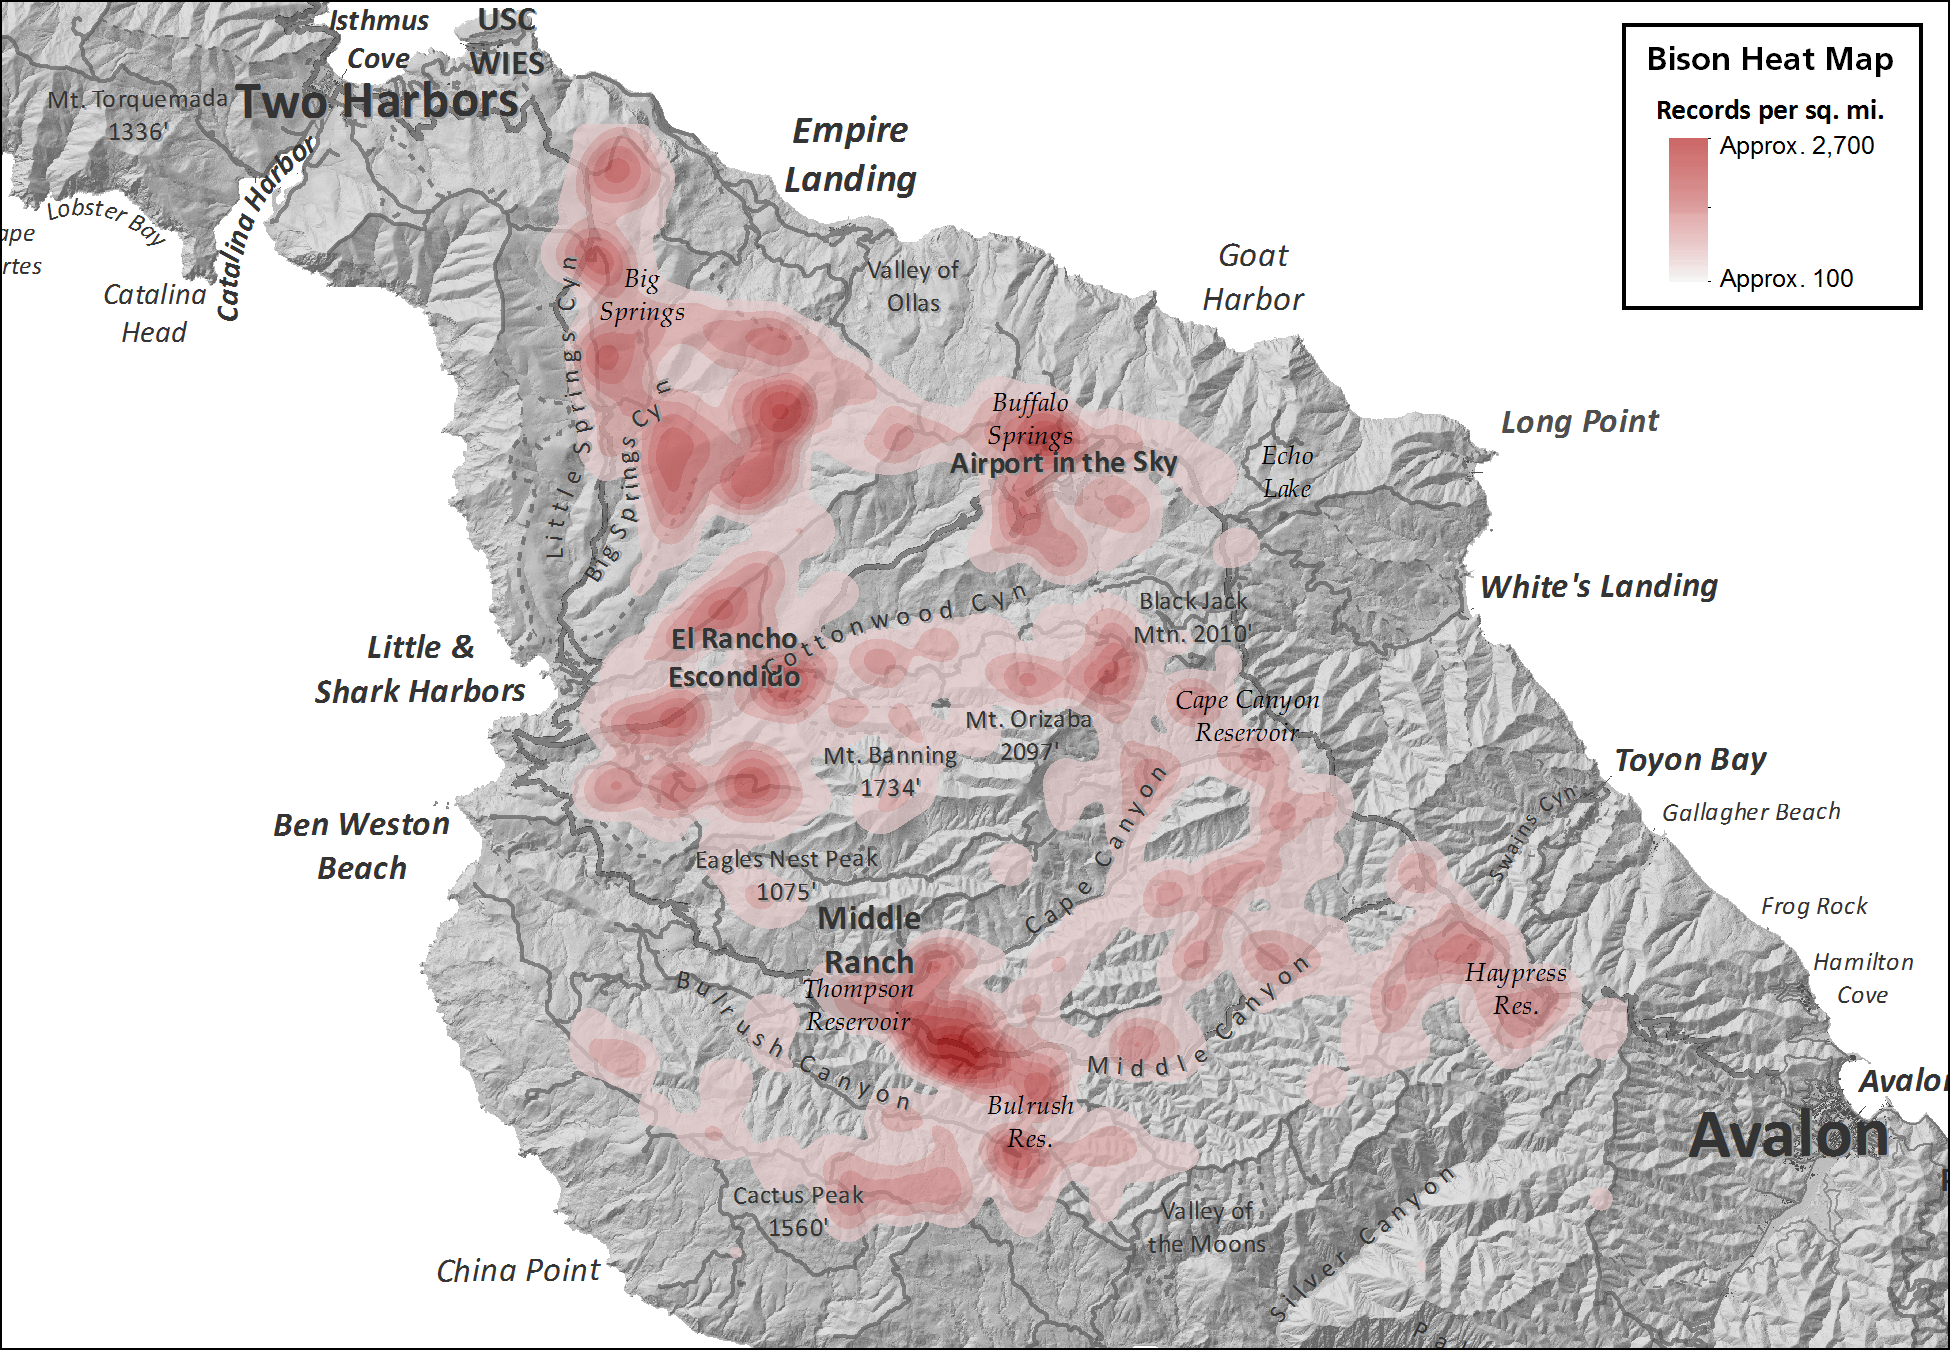
Between the date of deployment (May 10 and 11, 2014) and December 31, 2015, the five collars collectively recorded 26,881 location points. Based on my monitoring data (number and identification of bison cows and bulls found consistently in close proximity to collared individuals), these five collars effectively represented approximately 85-90% of the Catalina bison population at all times.
I worked with the Catalina Island Conservancy’s geographic information system (GIS) specialist at the time (Ben Coleman) to complete a preliminary assessment of bison high-use areas based on these locational data. A kernel density tool in ArcGIS was used to produce a heat (i.e., density) map demonstrating the primary use areas of the Catalina bison population between May 10, 2014, and December 31, 2015.
A search radius of 1 km2 and cell output of 100 m x 100 m was used in an attempt to incorporate the locations of nearby non-collared bison and areas between recorded location points. It should be noted that areas where there is no “heat” do not imply zero use, but that <200 locations fixes per km2 were recorded, implying very low levels of use.
Areas of highest use were generally associated with permanent water sources such as Conservancy-provided water troughs (n=10), natural springs, or small earthen reservoirs originally dug out to provide water for livestock. The total use area generated from this approach was 39.2 km2.
Additional survey data collected by the Conservancy’s Jeep Eco-Tour drivers provided some insight into the locations for solitary or bachelor bulls not commonly found within the mixed groups. These locations were not included in the production of the heat map but were found to overlap quite consistently within the areas used by the larger groups.
By September 2016, all five GPS collars had ceased operation (batteries expired prematurely on two) and dropped off, and three of the five have been successfully recovered. The extremely weak, very-high-frequency (VHF) signals associated with these collars and the inability of the collars to record location data once they have dropped prevented me from recovering two of the collars.
Bison Carrying Capacity on Catalina Island
As part of their study of the population ecology and ecological impacts of bison on Catalina Island, Sweitzer et al. (2003) utilized observed bison locations and existing vegetation and soil data to estimate a suitable bison range area of approximately 91 km2 on Catalina’s east end.
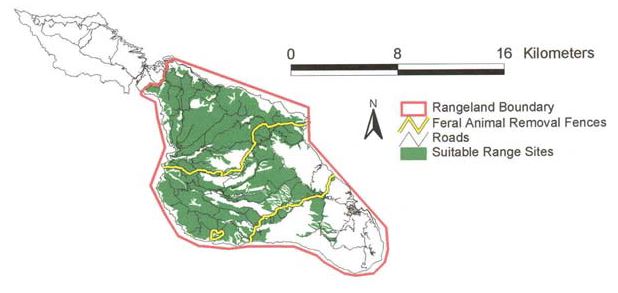
It was from this range area that Sweitzer et al. determined the potential carrying capacity of Catalina for bison and recommended stocking rates for the three management options outlined in their study.
Under the option in which bison have full access to this range area, Sweitzer et al. recommended a stocking rate of no more than 142 bison.
From my GPS collar data, I estimated that the majority of bison were only accessing approximately 39.2 km2 of this area, suggesting that the suitable range area was initially over-estimated or has changed considerably since 2001/2002.
In either instance, this would indicate that the stocking density should at least be reduced to match current conditions and conservatively set to allow for future changes.
Thank you for visiting WildlifeDetections.com. Check back often for new content or subscribe to my newsletter to receive updates on new articles, and if you have enjoyed this post, please don’t hesitate to share.

Hello! I write books on STEM subjects for teenagers, and I’m currently putting ideas together for a new book about the rescue and recovery of the Channel Island Fox. Your name was on some of the research papers I’ve read, and that led me to your website here. (If the Island Fox book is a success, by the way, I’d love to follow it up with a book about the Catalina bison.) Would you be willing to answer some follow-up questions about your experiences? I try to look for some smaller details or anecdotes that would help my pre-teen and teenage audience connect with the overall story. If you’re interested, please reply to the email address I’ve given here. Thanks in advance.
Hi Robert. I would be happy to answer any questions you have. I’ll connect with you through your email. Take care.